


Amsterdam Weather, Riso Print
€30,00
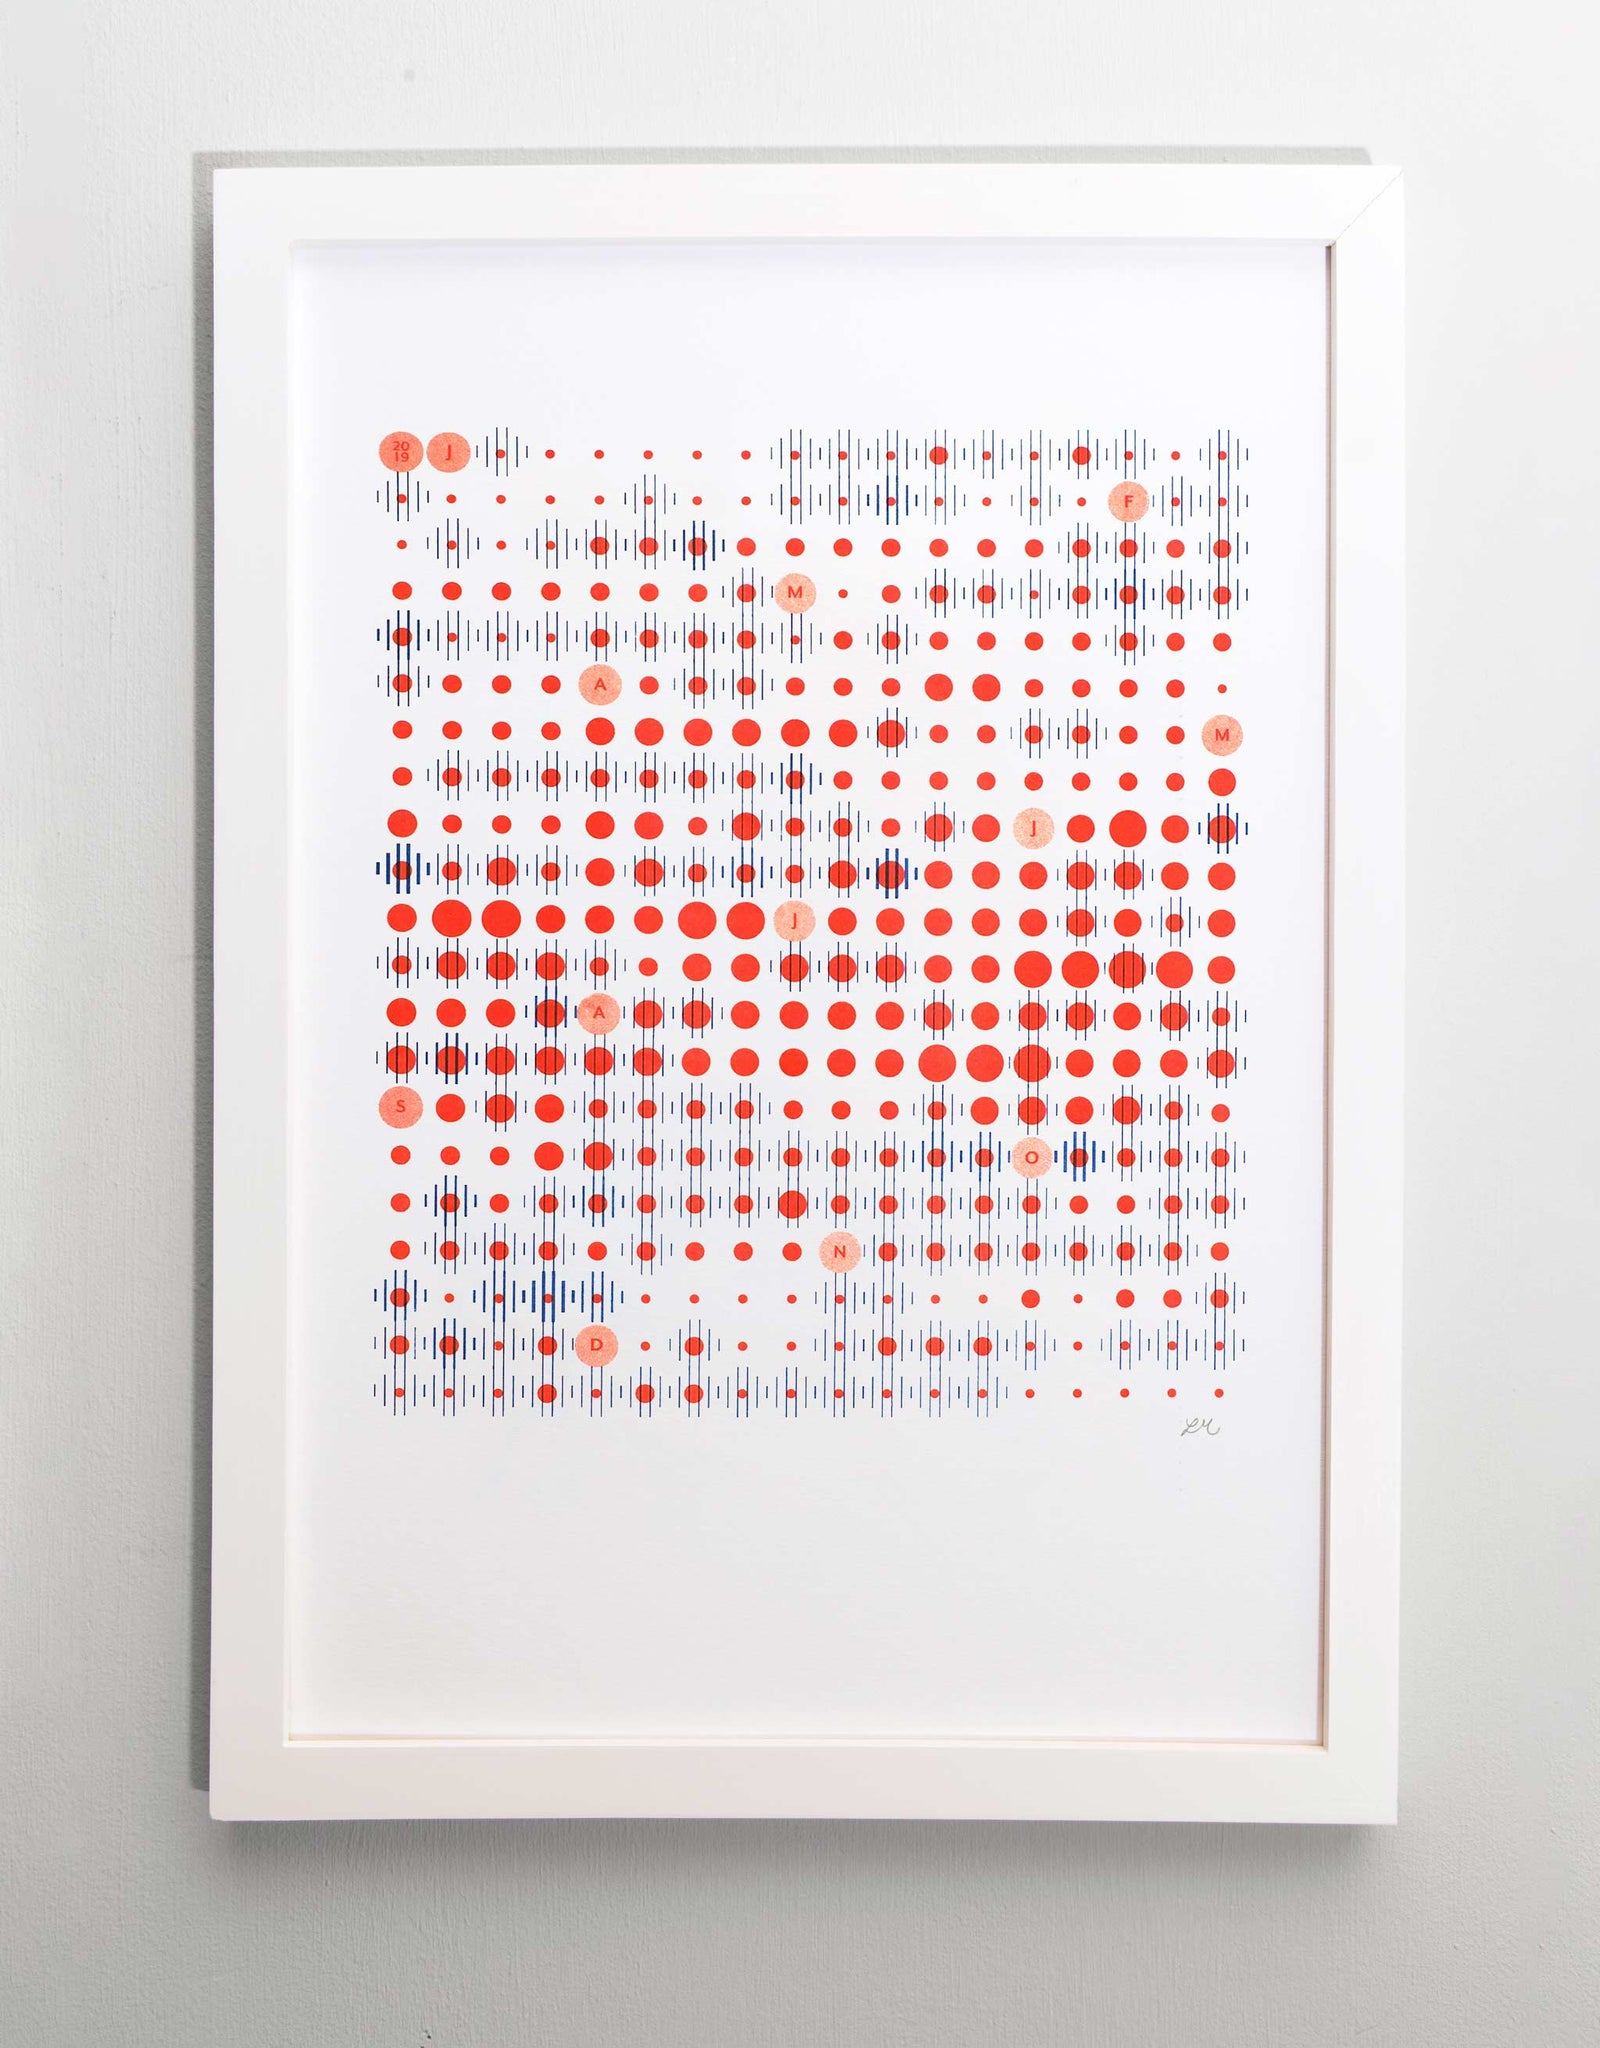
For those who are always eager to talk weather, love statistics or are looking for a modern data visualisation to brighten their home. This print tells a story of time and place.

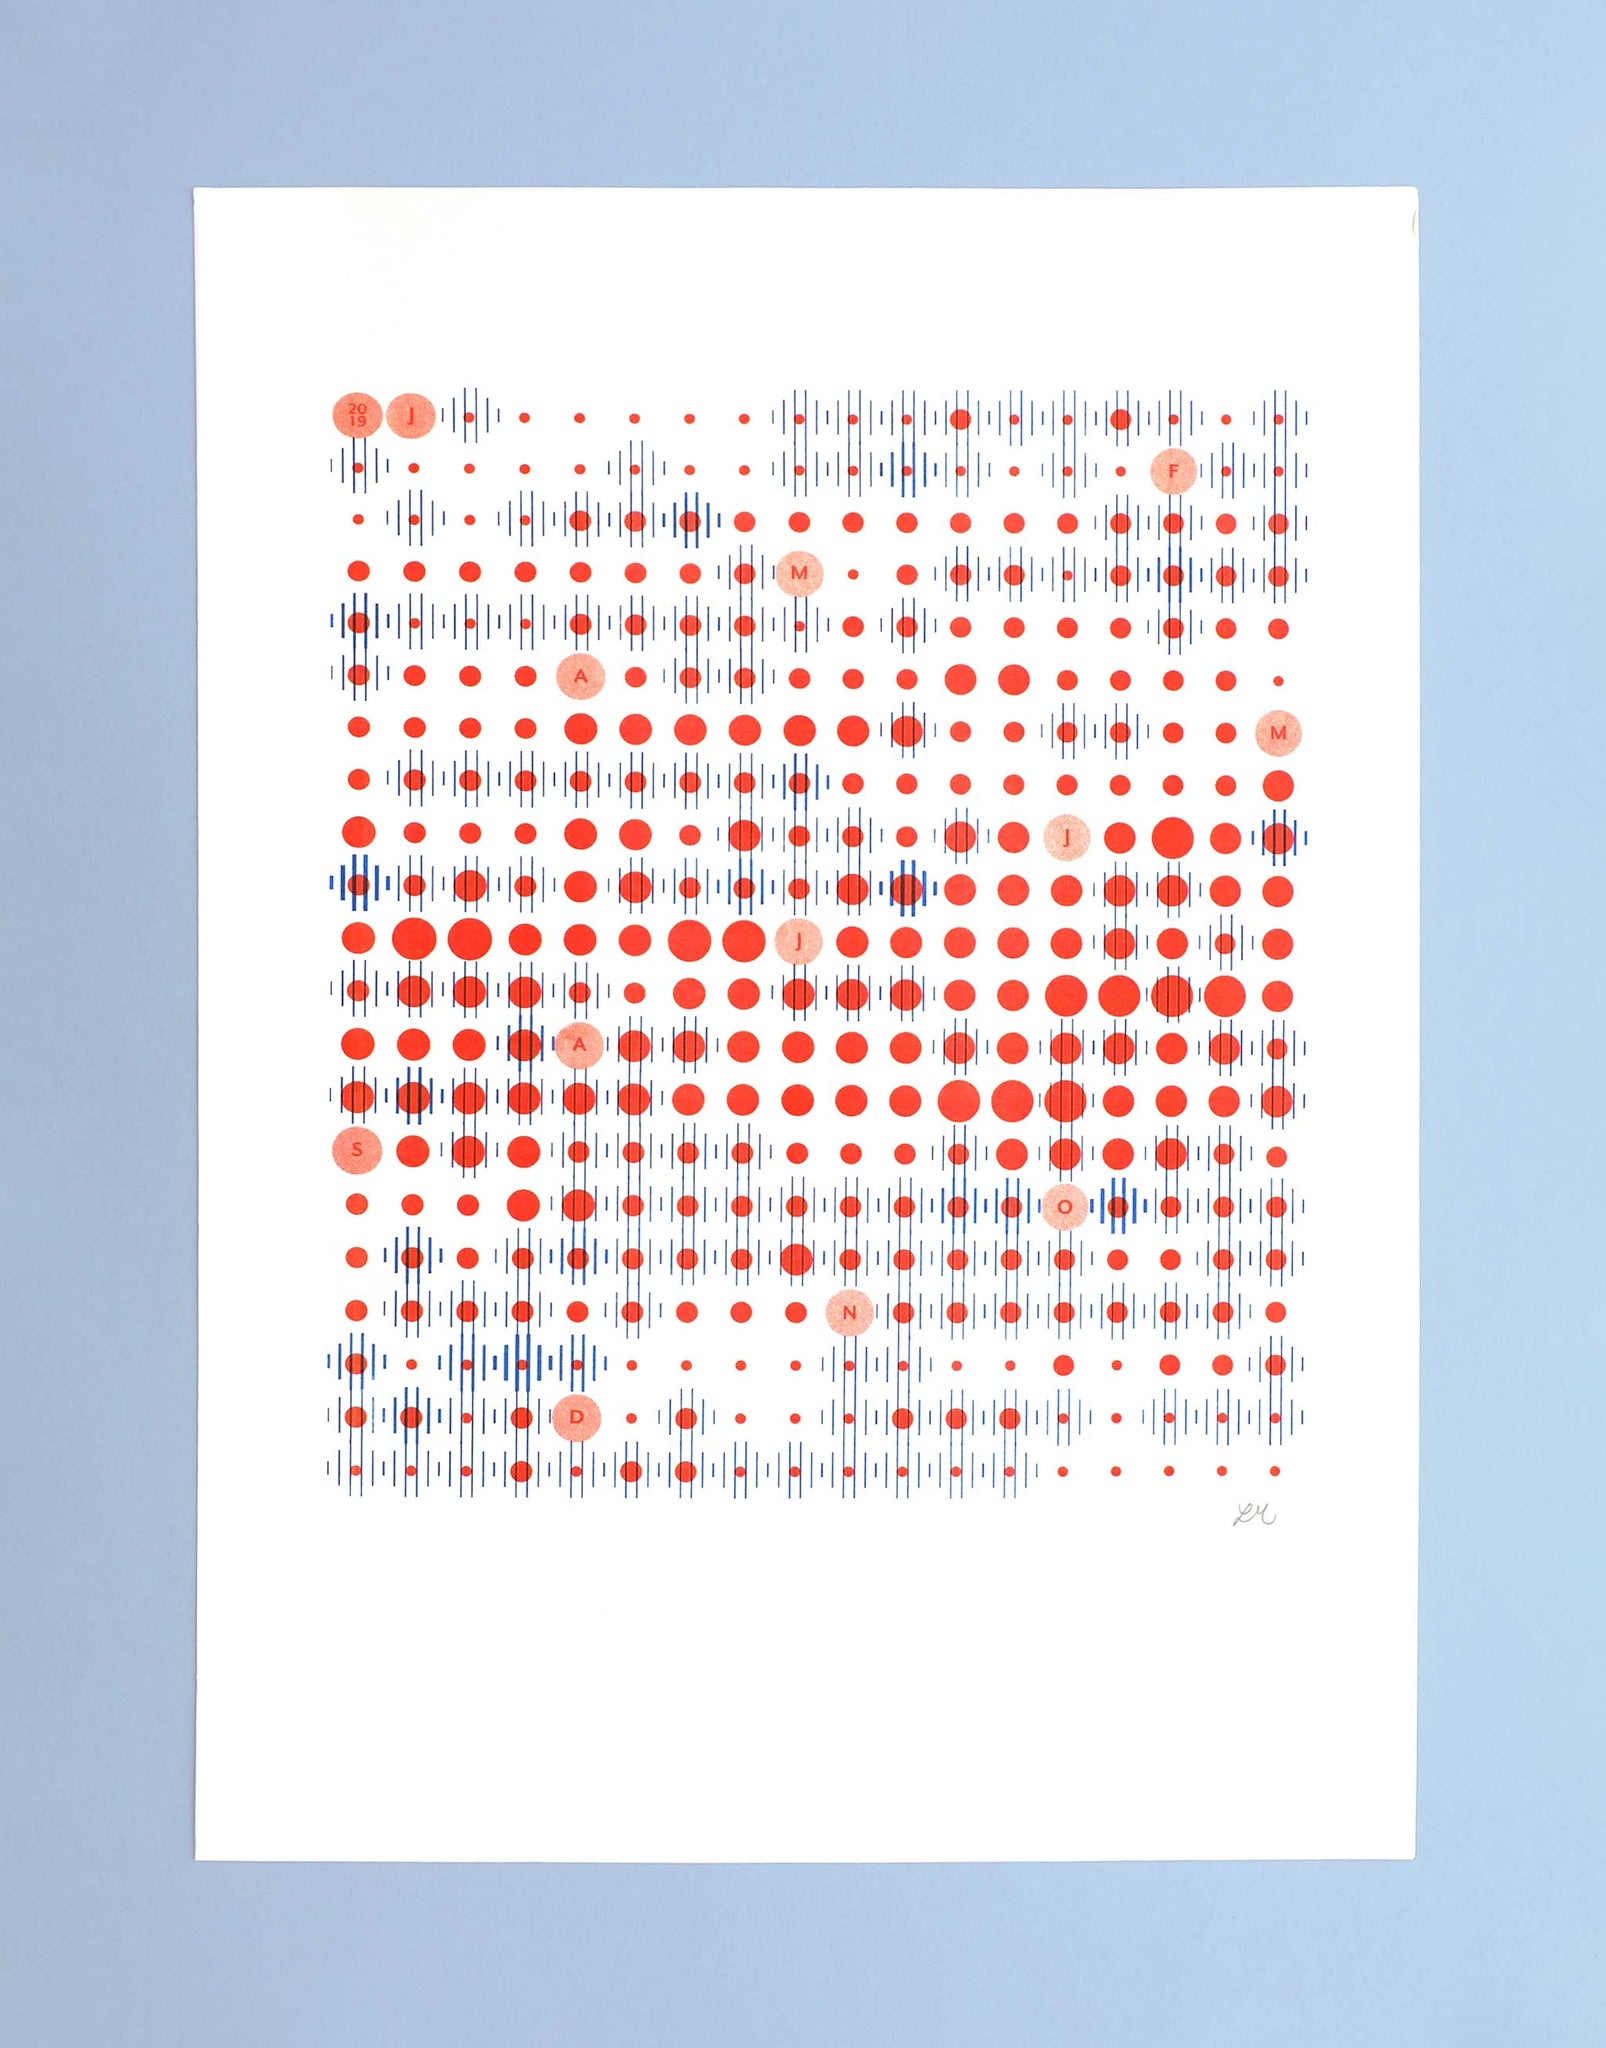
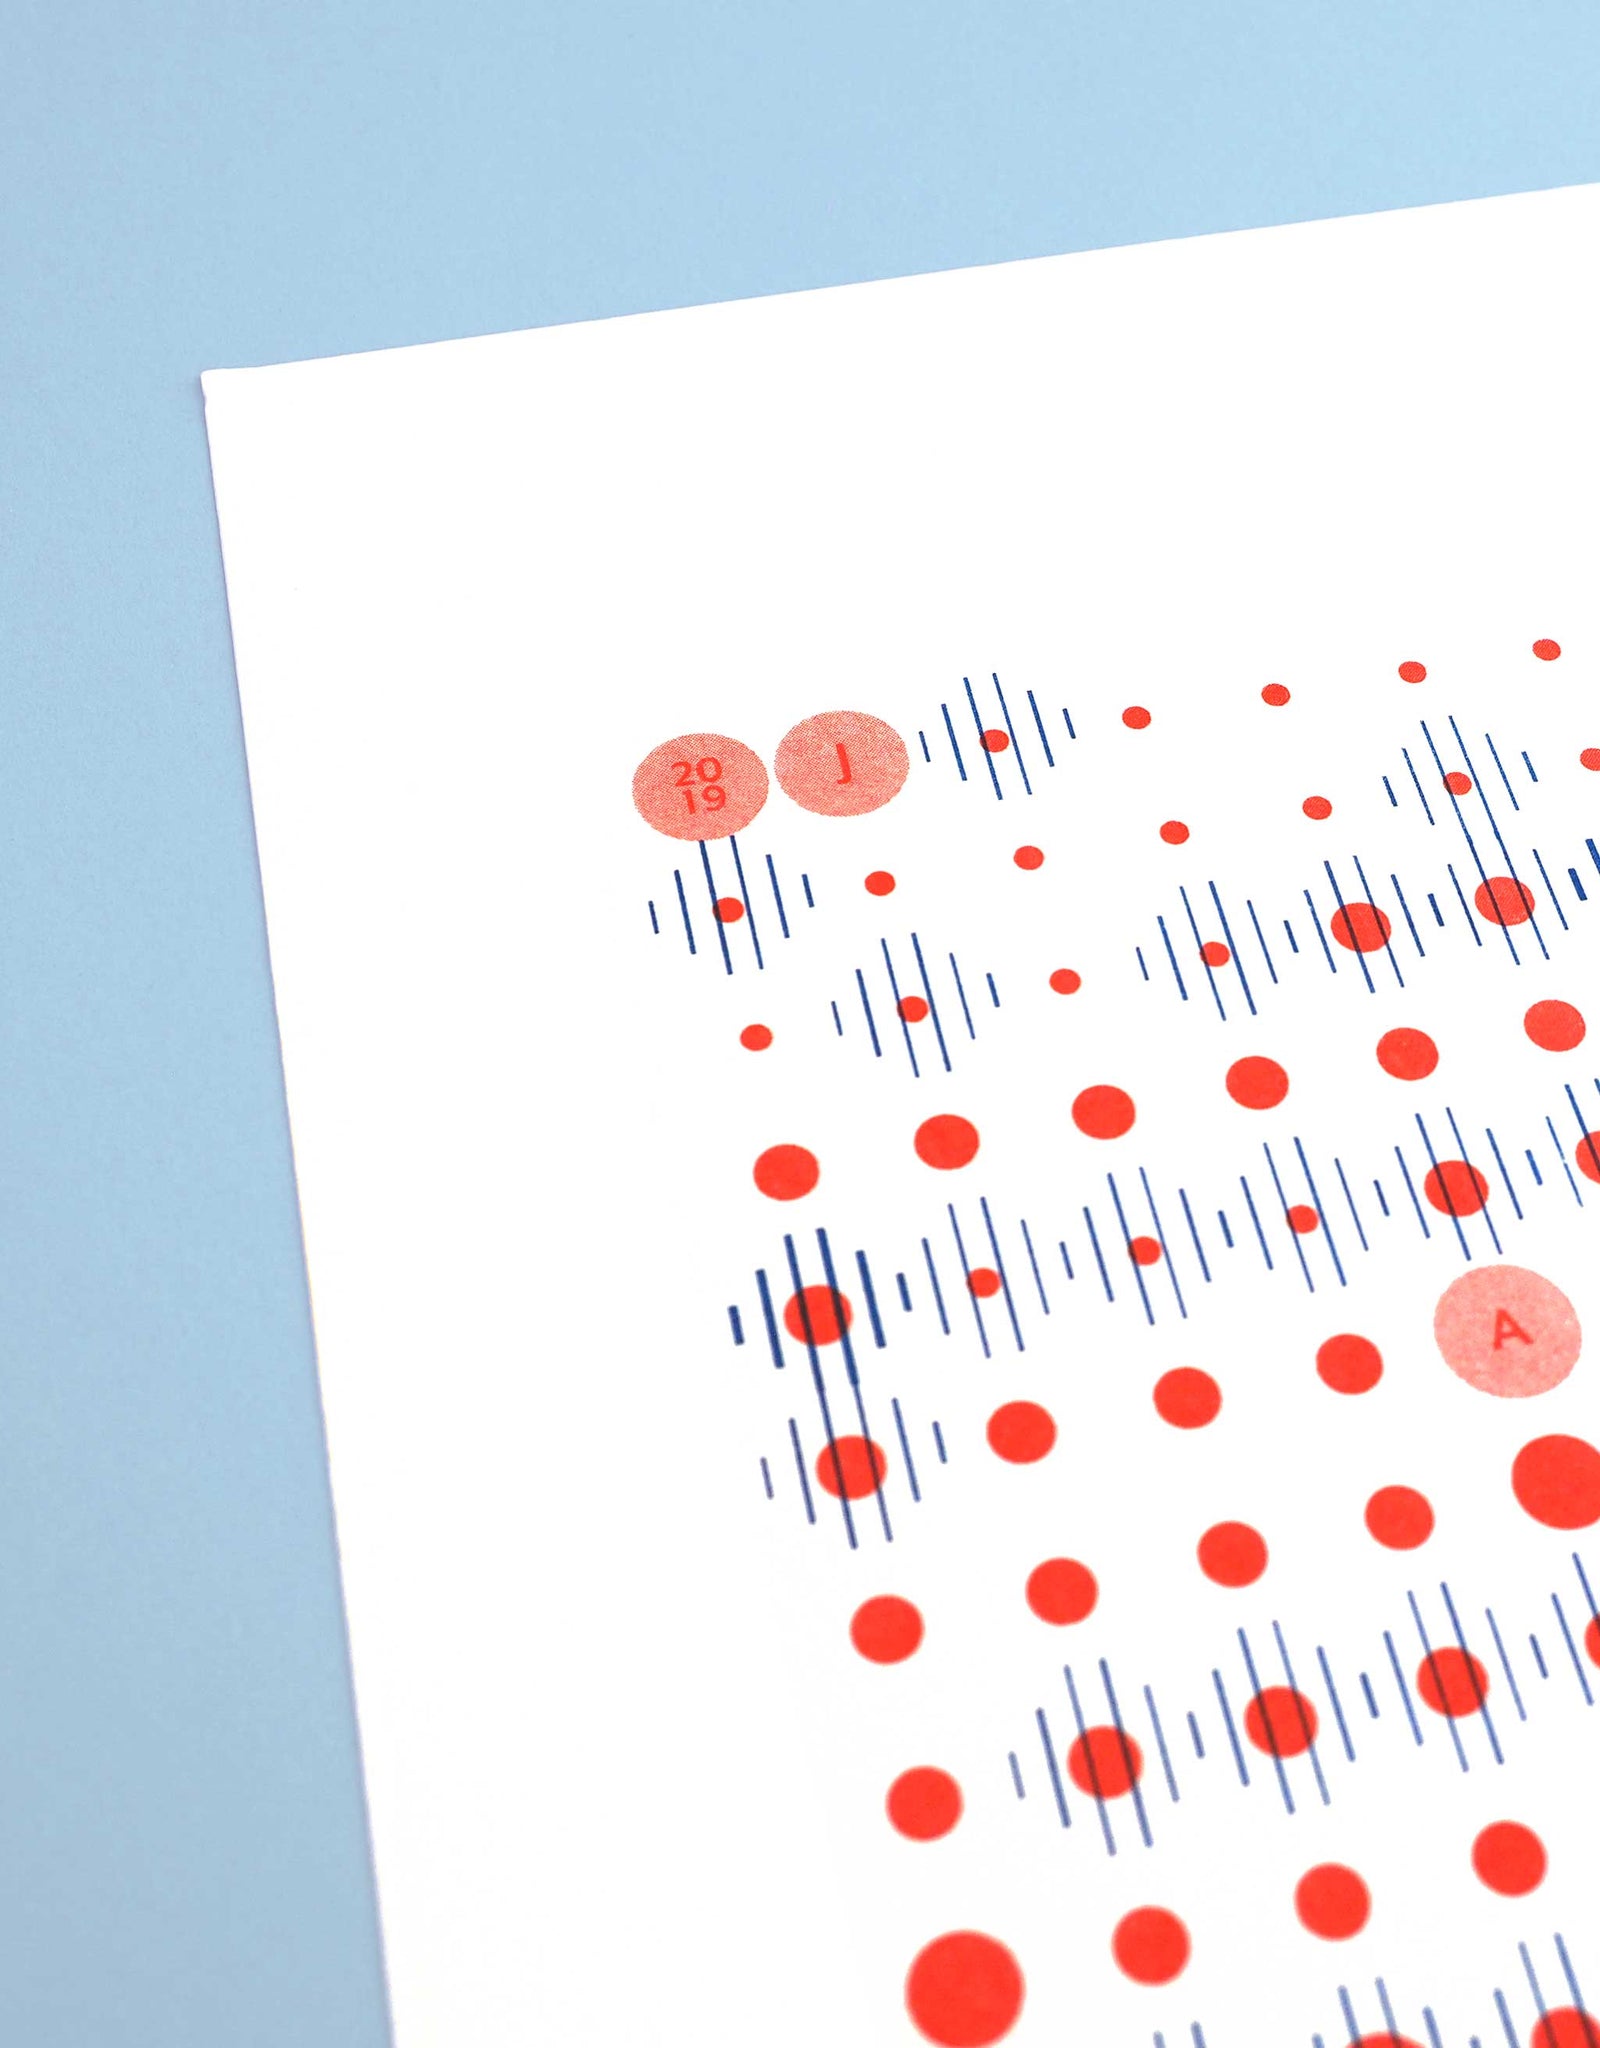
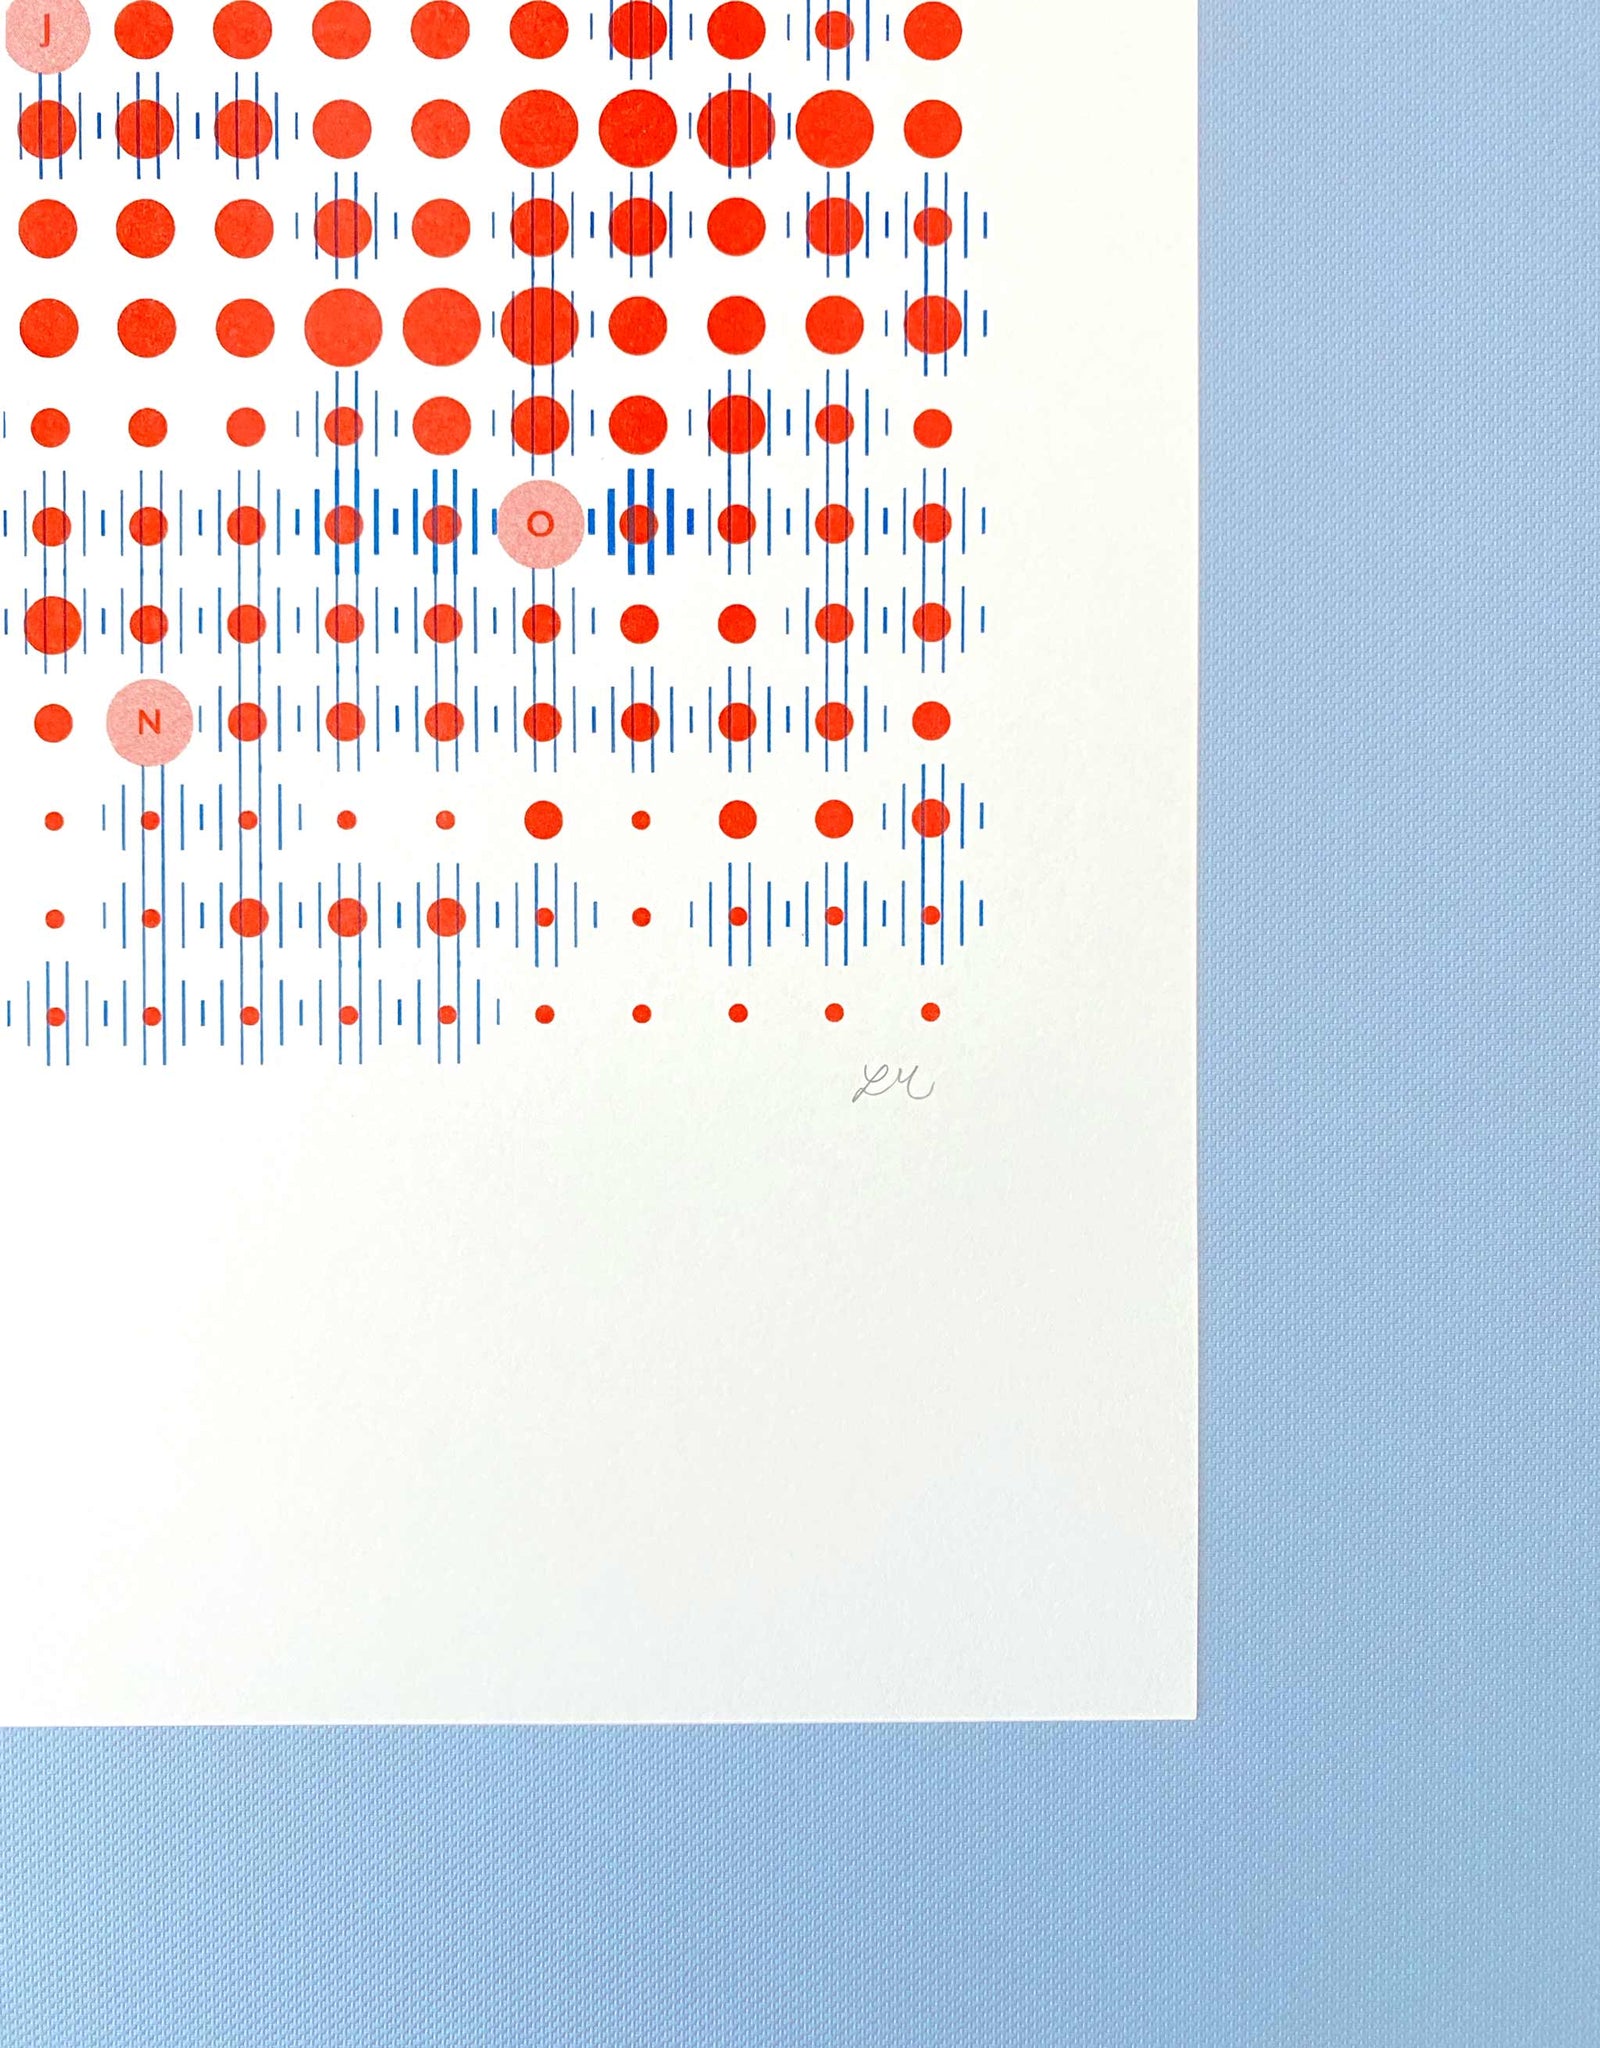
We experience it daily but how can weather patterns be interpreted visually?
If you’ve visited Amsterdam or are lucky enough to call this city home then these patterns may look familiar to you.
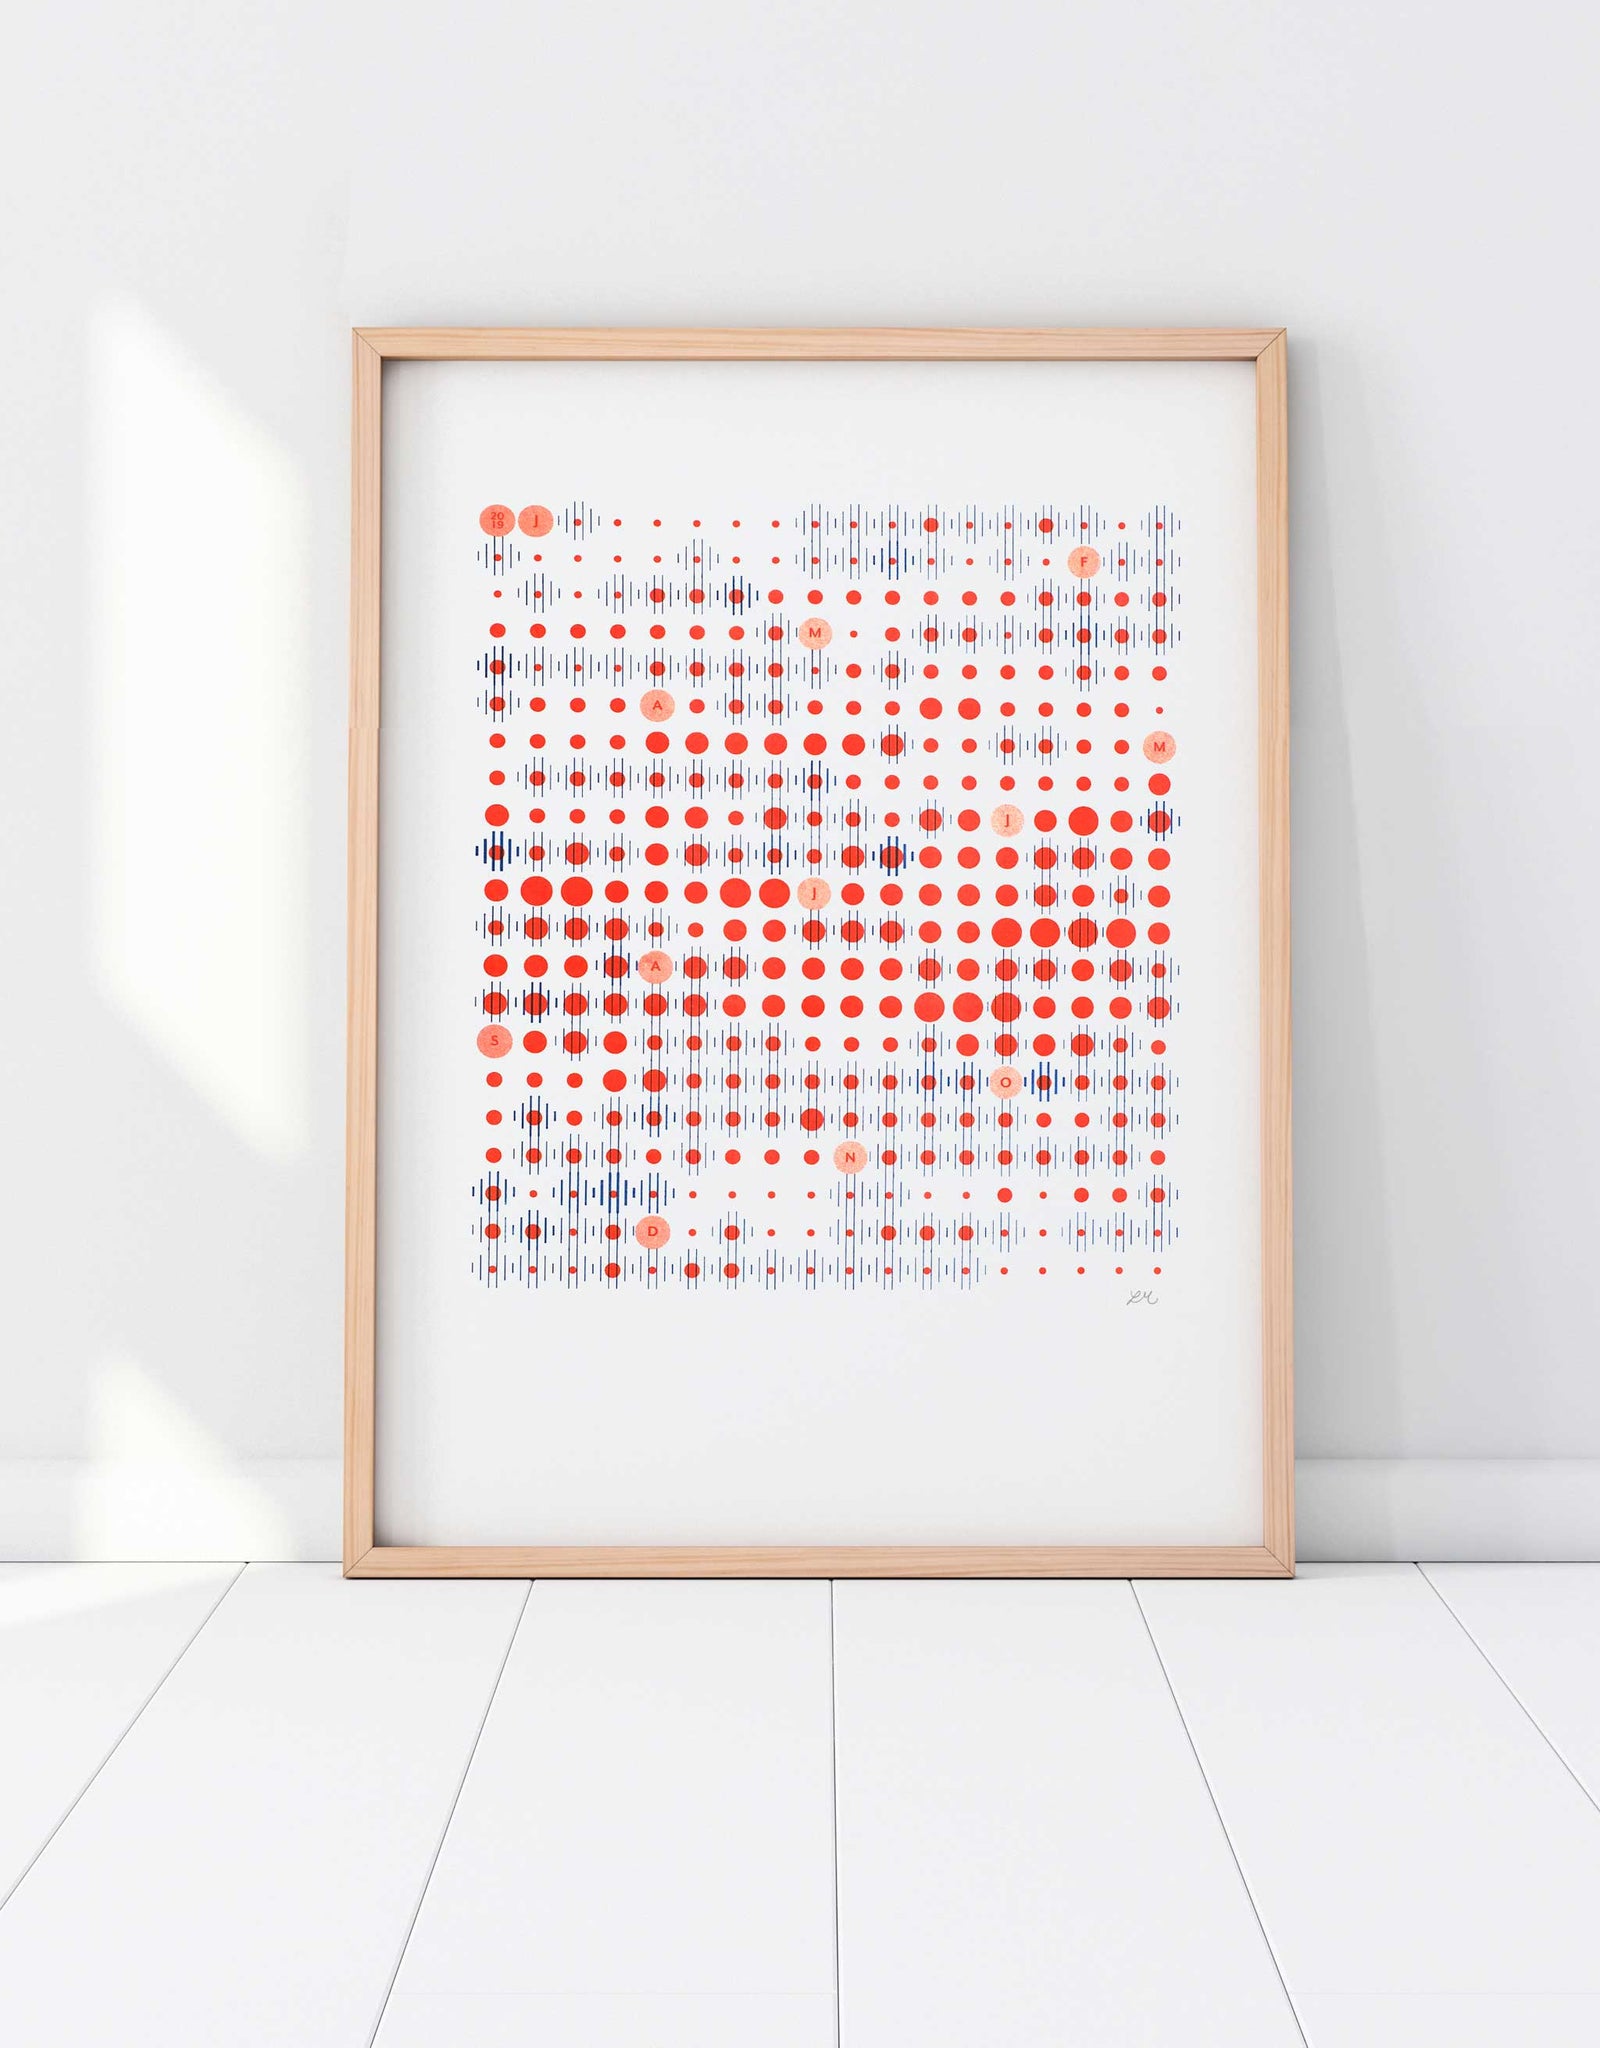
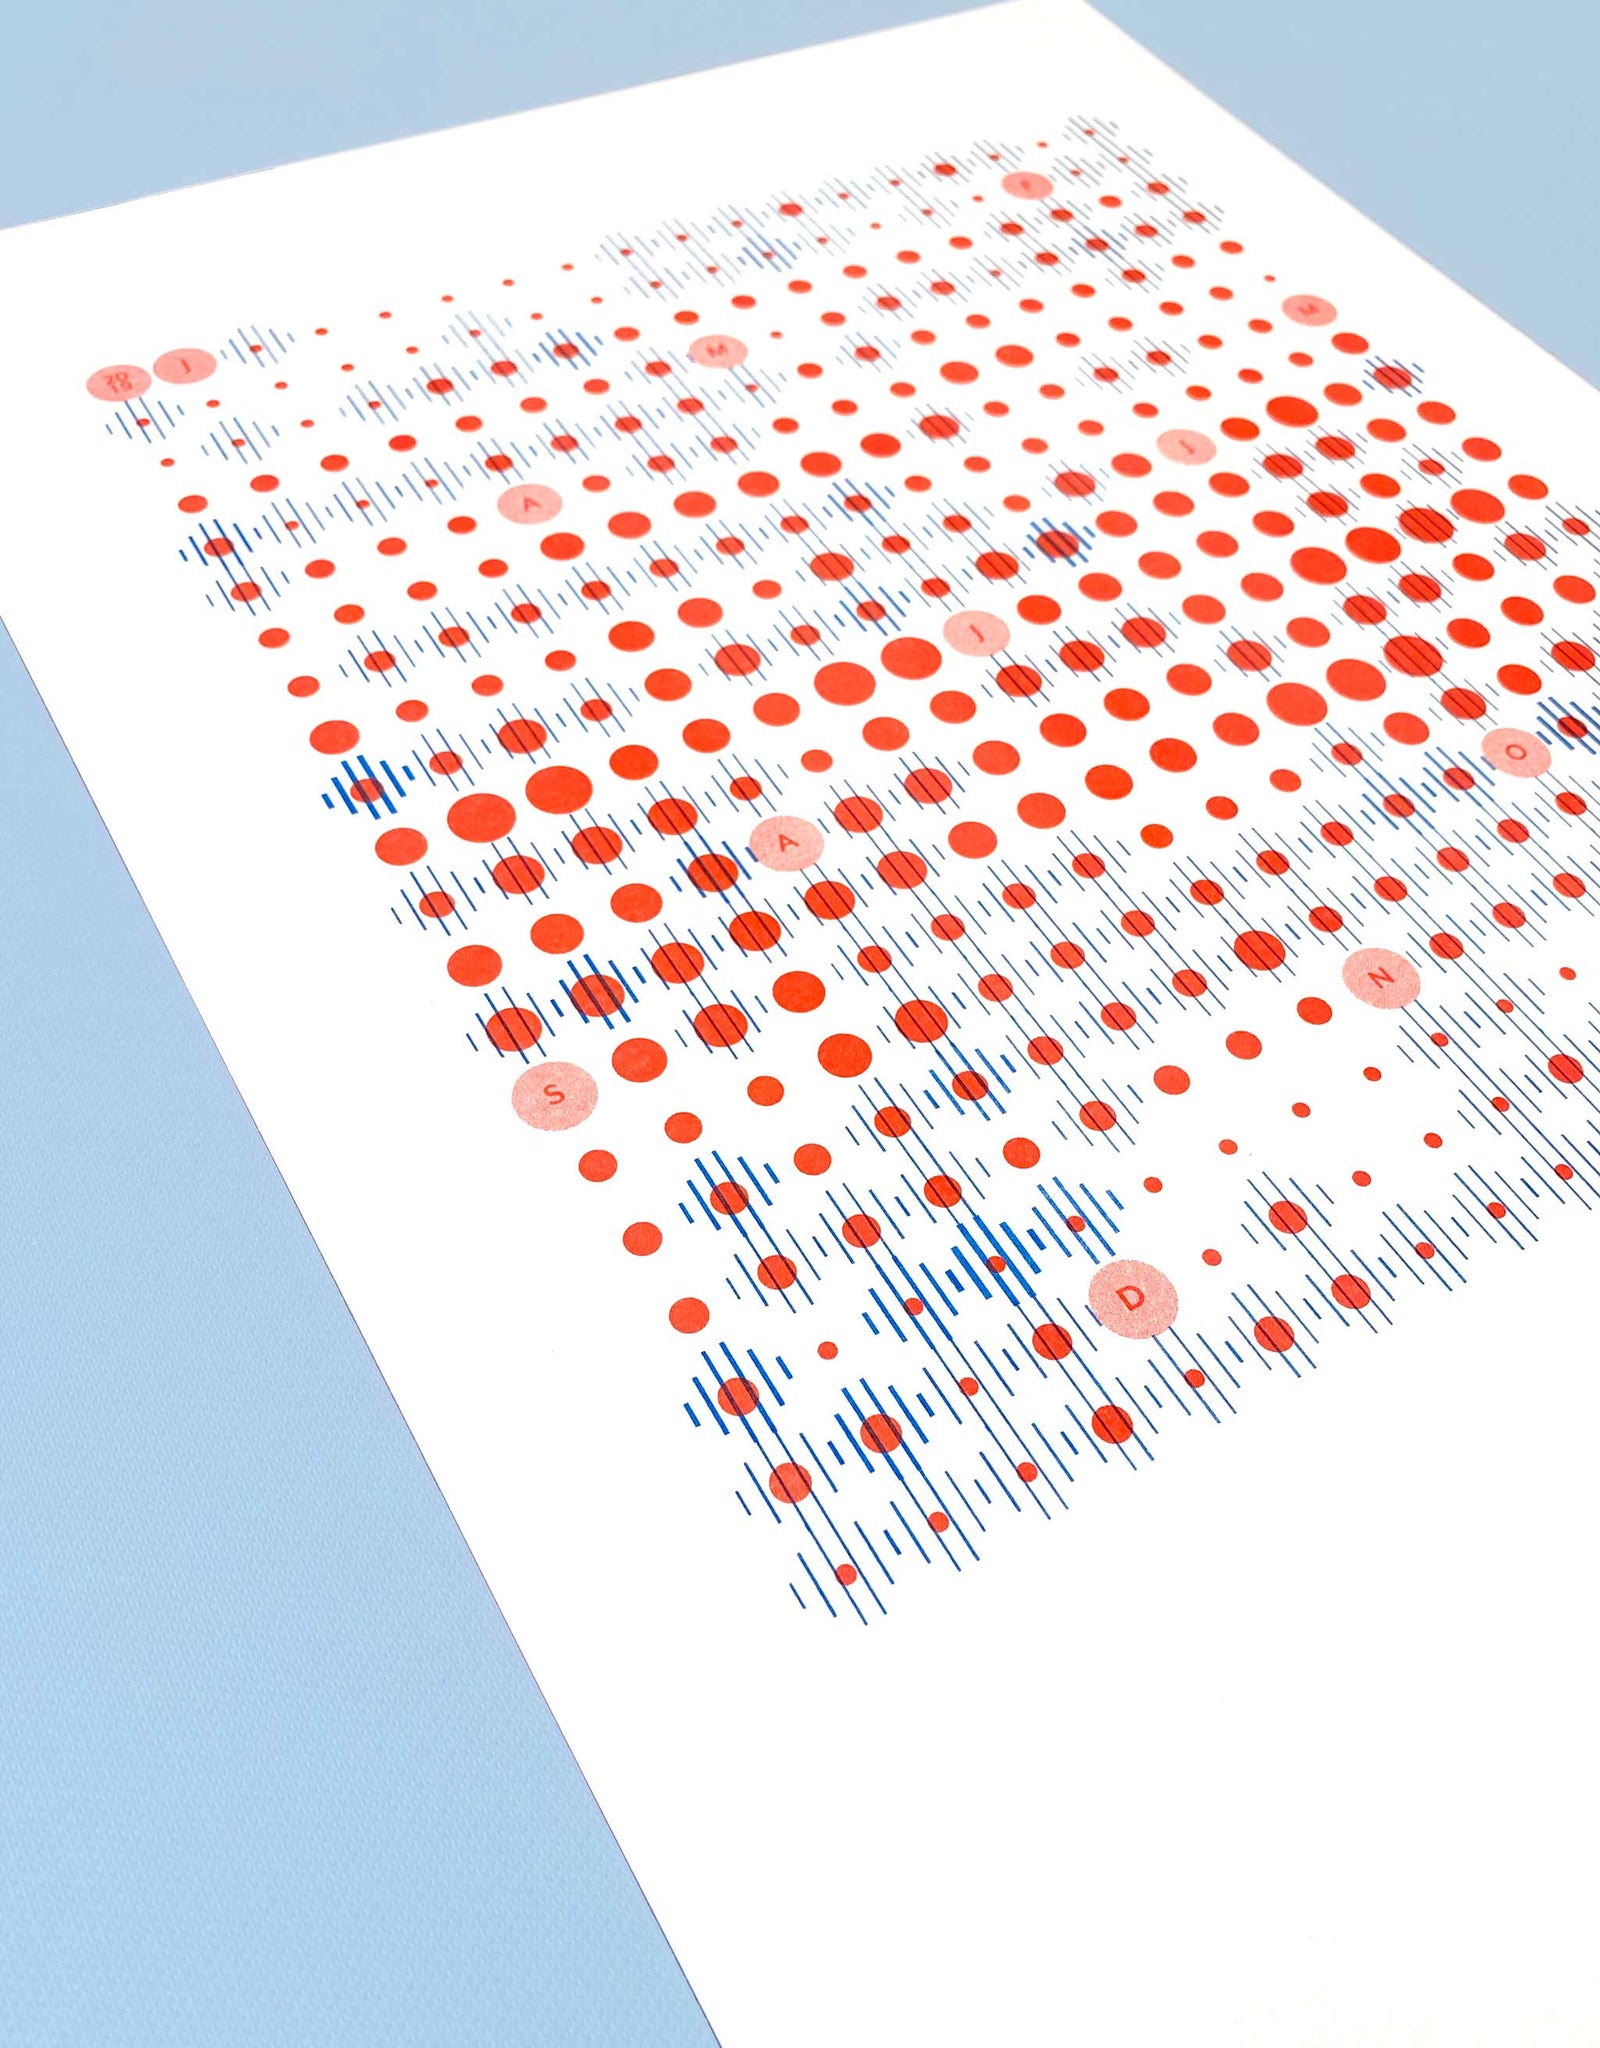
This visual chart is an illustrated retrospective. It highlights the regular rainfall and fluctuating heat over one complete year in 2019.

- Each print is signed
- Small batch printing made in Amsterdam
- Printed label explaining this data visualisation and history of Risograph production process is included
THE FINER DETAILS:
3 SIZES AVAILABLE — A3 (297x420mm), A4 (210x297mm) and A5 (148x210mm)
DESIGN — Weather pattern in Amsterdam throughout 2019
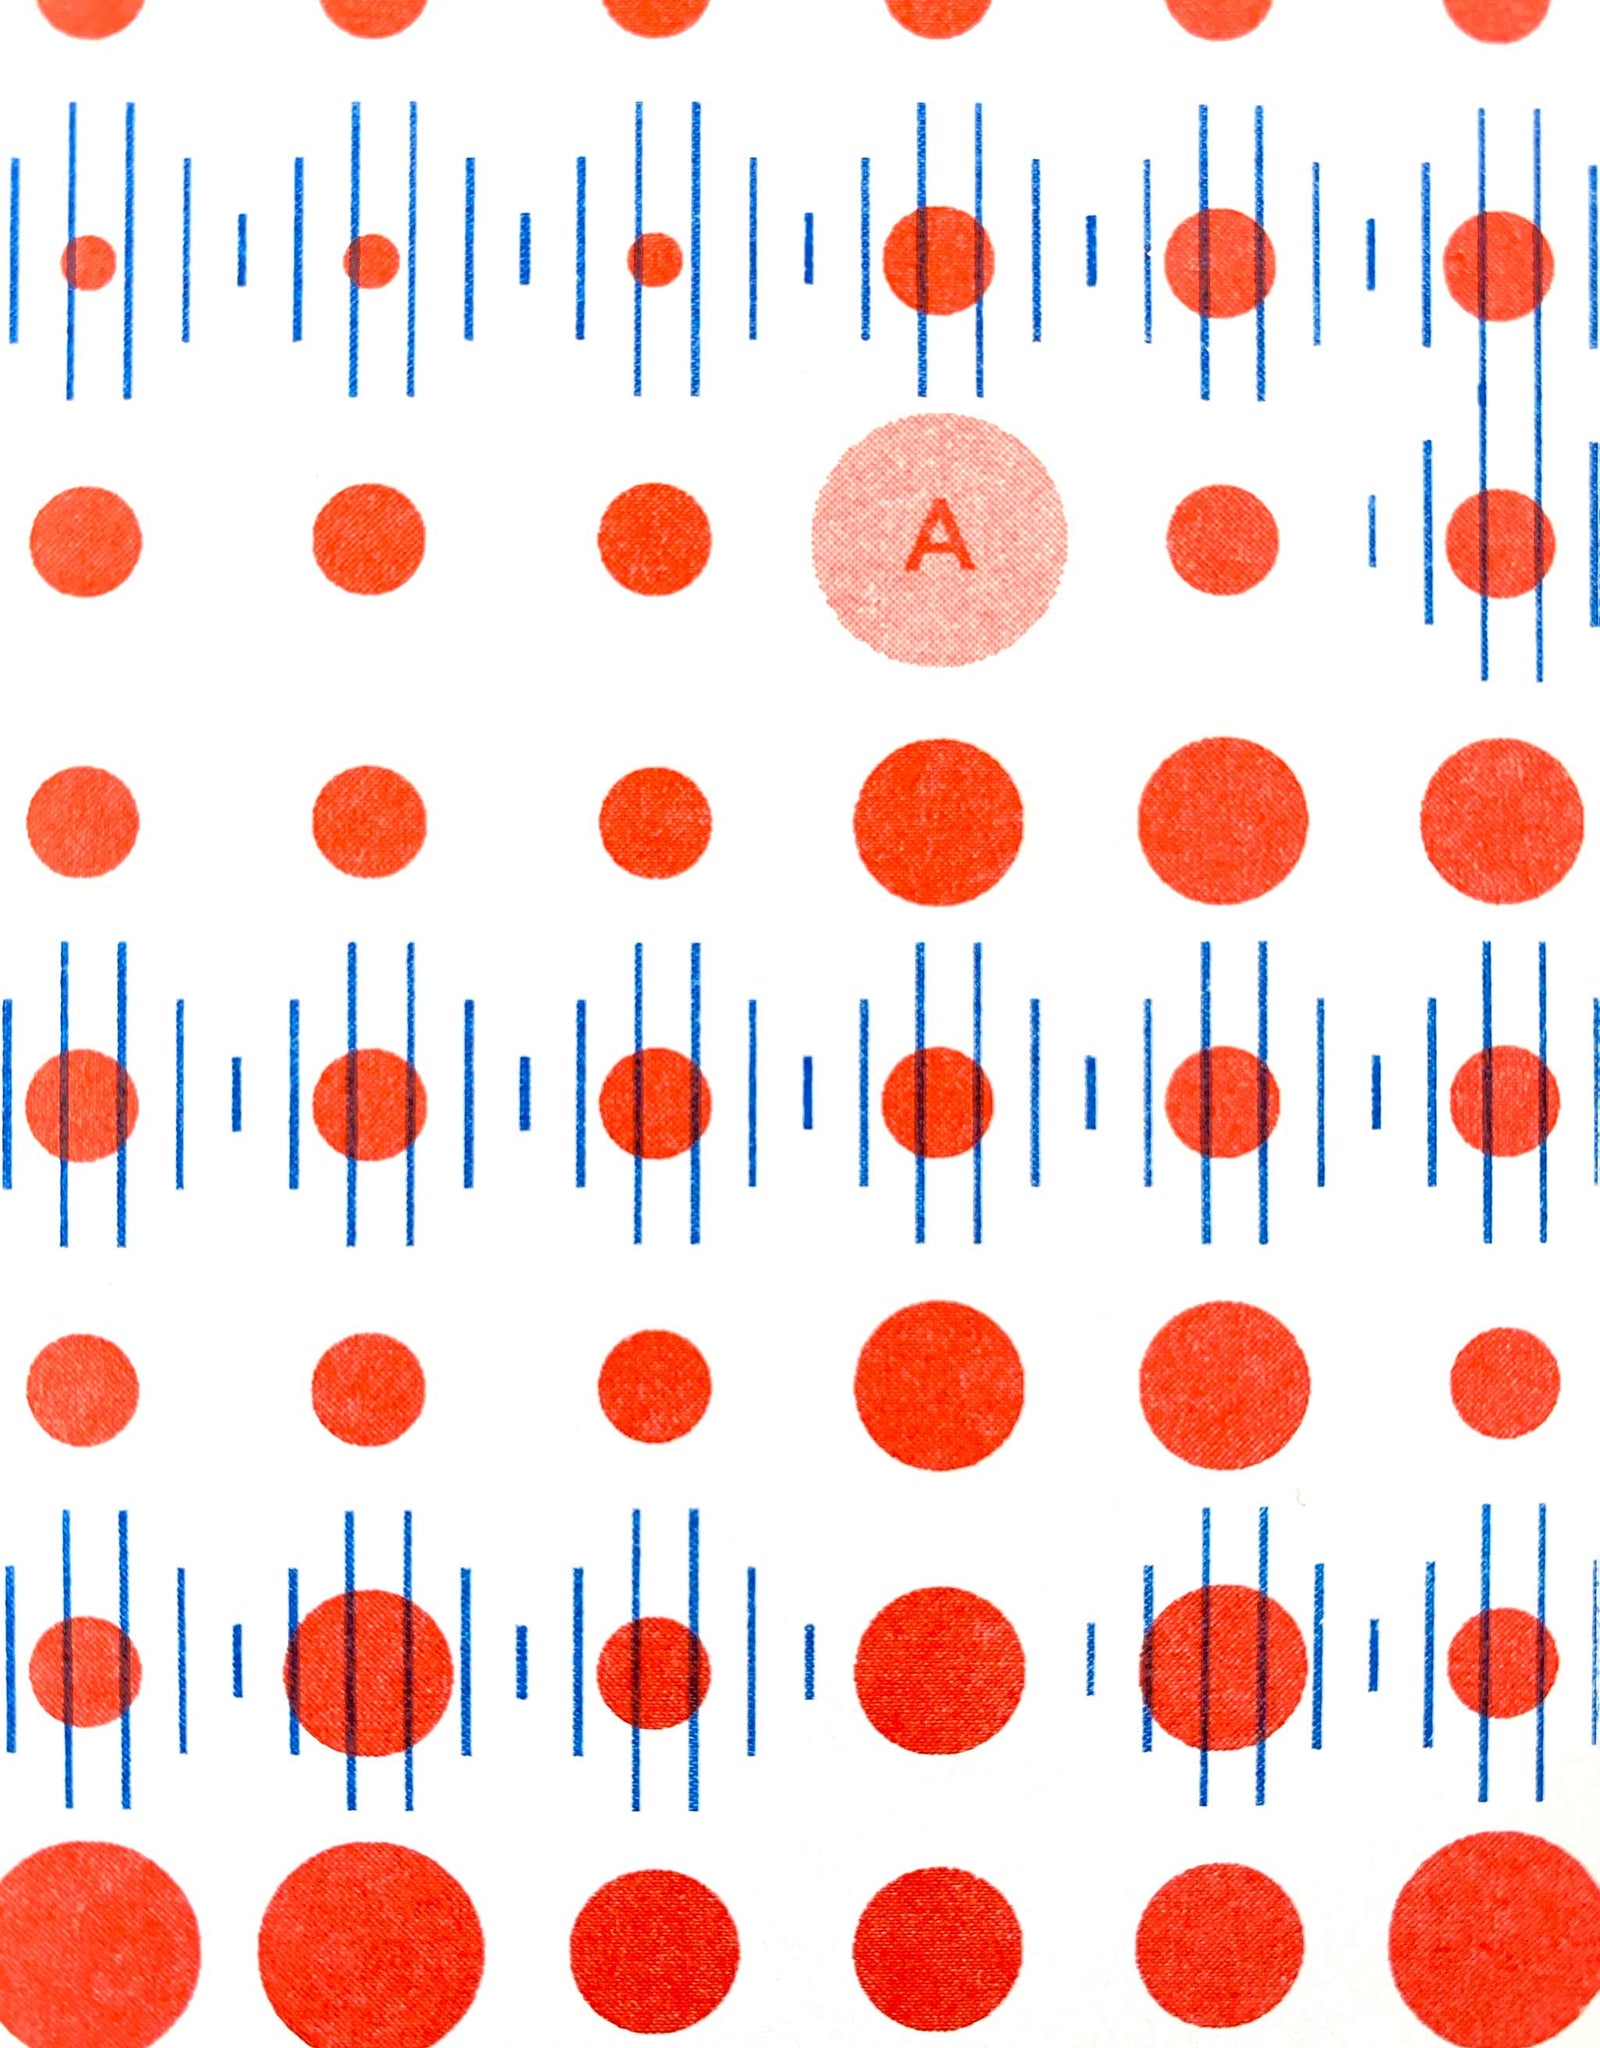
2 COLOUR PRINT — Red and Blue Risograph Print
PRODUCTION — Printed by hand in Amsterdam
Packaged in an acid free, pH neutral pergamine sleeve